Service Manuals, User Guides, Schematic Diagrams or docs for : HP Publikacje 5989-0563EN
<< Back | HomeMost service manuals and schematics are PDF files, so You will need Adobre Acrobat Reader to view : Acrobat Download Some of the files are DjVu format. Readers and resources available here : DjVu Resources
For the compressed files, most common are zip and rar. Please, extract files with Your favorite compression software ( WinZip, WinRAR ... ) before viewing. If a document has multiple parts, You should download all, before extracting.
Good luck. Repair on Your own risk. Make sure You know what You are doing.
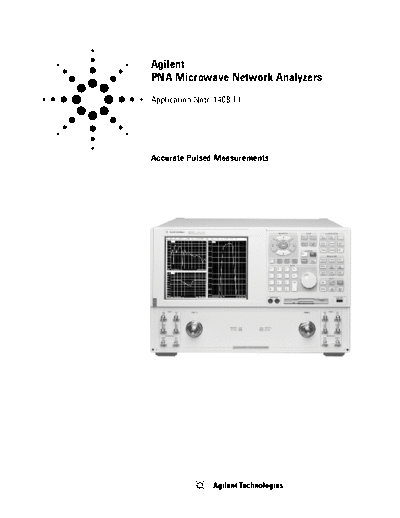
Image preview - the first page of the document
>> Download 5989-0563EN documenatation <<
Text preview - extract from the document
Agilent
PNA Microwave Network Analyzers
Application Note 1408-11


Accurate Pulsed Measurements
                           High Performance Pulsed S-parameter Measurements
                           Vector network analyzers are traditionally used to measure the continuous wave (CW)
                           S-parameter performance of components. Often under these operating conditions the
                           analyzer is functioning as a narrowband measurement instrument. It transmits a known
                           CW frequency to the component and measures the CW frequency response. If we were
                           to look at the response of a single CW frequency we would see a single spectral tone in
                           the frequency domain. The analyzer has a built in source and receivers that are designed
                           to operate together in a synchronous manner, utilizing narrowband detection, to measure
                           the frequency response of the component. Most analyzers can be configured to generate
                           a frequency sweep over many frequency tones.

                           In some cases the signal applied to the component must be pulsed (turned on and off)
                           at a specific rate and duration. If we were to look at the frequency domain response of
                           a single pulsed tone, it would contain an infinite number of spectral tones making it
                           challenging to utilize a standard narrowband VNA. This article describes how to configure
                           and make accurate pulsed S-parameter measurements using the Agilent microwave
                           PNA network analyzer.


                           Pulsed Signals
                           To see what the frequency domain spectrum of a pulsed signal looks like we first
                           mathematically analyze the time domain response. Equation 1 illustrates the time domain
                           relationship of a pulsed signal. This is generated by first creating a rectangular windowed
                           version (rect(t)) of the signal with pulse width PW. A shah function is then realized
                           consisting of a periodic train of impulses spaced 1/PRF apart where PRF is the pulse
                           repetition frequency. This can also be viewed as impulses at spacing equal to the pulse
                           period. The windowed version of the signal is then convolved with the shah function to
                           generate a periodic pulse train in time corresponding to the pulsed signal.
                                                                                  1 (t)
                                         y(t) = (rectpw(t)
◦ Jabse Service Manual Search 2024 ◦ Jabse Pravopis ◦ onTap.bg ◦ Other service manual resources online : Fixya ◦ eServiceinfo