Service Manuals, User Guides, Schematic Diagrams or docs for : Agilent journals 1964-08
<< Back | HomeMost service manuals and schematics are PDF files, so You will need Adobre Acrobat Reader to view : Acrobat Download Some of the files are DjVu format. Readers and resources available here : DjVu Resources
For the compressed files, most common are zip and rar. Please, extract files with Your favorite compression software ( WinZip, WinRAR ... ) before viewing. If a document has multiple parts, You should download all, before extracting.
Good luck. Repair on Your own risk. Make sure You know what You are doing.
Image preview - the first page of the document
>> Download 1964-08 documenatation <<
Text preview - extract from the document
                                                   HEWLETT-PACKARD

                                                 JOURNAL
                                                 T E C H N I C A L   I N F O R M A T I O N   F R O M   T H E   - h p   L A B O R A T O R I E S

                                                                                                                                                                           Vol. 15, No. 12

lUBLISHED BY THE HEWLETT-PACKARD COMPANY, 1501 PAGE MILL ROAD, PALO ALTO, CALIFORNIA                                                                                      AUGUST, 1964


                                           A New Microwave Spectrum Analyzer
                                             A new spectrum analyzer displays up to 2,000 Mega
                                             cycles of the spectrum at a time for RFI checking, spec
                                             trum surveillance, and other wide-band investigations.


                                                                                               IVliCROWAVE spectrum analyzers are swept-fre-
                                                                                               quency receivers with visual display. The basic
                                                                                               function of a spectrum analyzer is to plot input
                                                                                               signal amplitude as a function of frequency while
                                                                                               the analyzer automatically tunes through a
                                                                                               selected range of frequencies.
                                                                                                  Spectrum analyzers are potentially useful in
                                                                                               the laboratory as well as in the field because they
                                                                                               provide quantitative information about several
                                                                                               signals simultaneously. For instance, they facili
                                                                                               tate adjustment of devices that operate with
                                                                                               several different frequencies at the same time,
                                                                                               such as parametric amplifiers. A spectrum ana
                                                                                               lyzer connected to an antenna can display a plot
                                                                                               of all detectable electromagnetic radiations over
                                                                                               a selected frequency band, indicate the relative
                                                                                               strength of each signal, and show individual fre
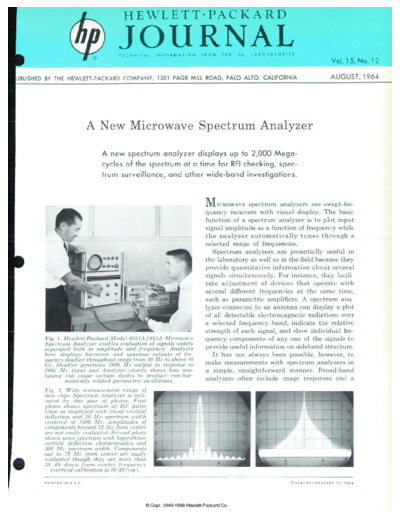
         Fig. 1. Hewlett-Packard Model 8551A/851A Microwave                                    quency components of any one of the signals to
         Spectrum Analyzer enables evaluation of signals widely
         separated both in amplitude and frequency. Analyzer                                   provide useful information on sideband structure.
         here displays harmonic and spurious outputs of fre                                       It has not always been possible, however, to
         quency doubter throughout range from 10 Me to above 10
         Gc. Doubler generates 3800 Me output in response to                                   make measurements with spectrum analyzers in
         1900 Me input and Analyzer clearly shows how mis-                                     a simple, straightforward manner. Broad-band
         tuning can cause certain diodes to produce non-har-
                 monically related parametric oscillations.                                    analyzers often include image responses and a
         Fig. 2. Wide measurement range of
         new
◦ Jabse Service Manual Search 2026 ◦ Jabse Pravopis ◦ onTap.bg ◦ Other service manual resources online : Fixya ◦ eServiceinfo